Distribution ของตัวแปร ทีได้จากการนับ เป็น เลขจำนวนเต็ม ไม่มีทศนิยม
(Counted Variable, Discrete Variable)
ถ้าเป็น Proportion สัดส่วน = a / (a + b) เช่น 8 / 20 หรือ 40 % (n = 20)
เศษ (Numerator) = 8
ส่วน (Denominator) = 20
P = 0.4, Q = 0.6, n = 20
Percent คือ Proportion ที่ทำให้ส่วนเป็น 100 (ระบุค่า n)
สัดส่วน Proportion = 8 / 20 อาจเขียนว่า P = 0.4, n = 20 หรือ Proportion = 40% (n = 20)
คำนวณค่า 95%CI ของ Single Proportion (ตัวแปรจากการนับ) เทียบค่า กับ Normal Curve
Z- Distribution ตัวแปรได้มาจากการชั่งตวงวัด ค่าต่อเนื่อง มีทศนิยมได้ Continuous Variable
ตัวอย่าง P = 0.4 หรือ 40% โดยที่ n = 20 และ n=30 Proportion คือ 8/20 และ 12/30
P จะยังคงจะเท่ากับ 0.4 หรือ 40% คงเดิม ถ้า n เพิ่มขึ้น ช่วงกว้างของ 95%CI จะลดลง
np = 8 (p=0.4, n=20)
95%CI Lower = mean - (1.96 x SE')
95%CI Upper = mean + (1.96 x SE')
และการคำนวณค่า 95%CI ของ Proportion โดยใช้
OpenEpi ซึ่งปรับค่า Proportion ให้เป็น %
และ STATA คำสั่ง cii #obs succ [, ciib_options]
กำหนดค่า P, Q = (1 - P) และ n
1) ตรวจสอบ np มากกว่า 5, nq มากกว่า 5
2) nP (เปรียบเทียบได้กับ Mean)
3) ตรวจสอบ nPQ มากกว่า 5 (Variance = PQ)
4) ถอดรูท 2 ของ PQ/N, SE'= sqrt(PQ/N)
5) 95% Lower Limit คือ Mean - (1.96 x SE')
95% Upper Limit คือ Mean + (1.96 x SE')
คำนวณ 95% CI ของ Single Proportion จาก OpenEpi ซึ่งใช้ค่า Percent
ใช้สำหรับ Large population ถ้าไม่เช่นนั้น ให้ใช้วิธีสุ่มตัวอย่างแบบใส่กลับคืน (sample with replacement) http://www.openepi.com/Proportion/Proportion.htm
"A continuity correction factor is used when you use a continuous function to approximate a discrete one. In simple terms, you use it when you want to approximate a binomial with a normal distribution."
http://www.statisticshowto.com/what-is-the-continuity-correction-factor/
http://www.statisticshowto.com/using-the-normal-approximation-to-solve-a-binomial-problem/
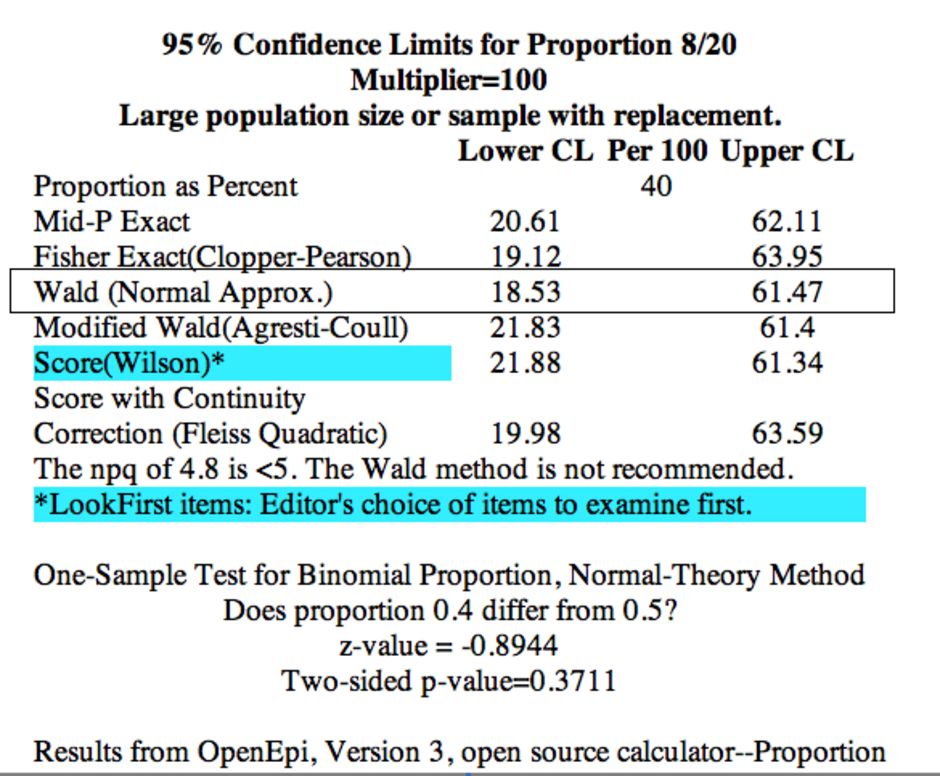
ภาพที่ 1 p=0.4, q=0.6, n=20
nP = 8 … (> 5) = Mean
nQ = 12 … (> 5)
nPQ = 4.8 … (< 5) !!
SE' = sqrt(.6*.4/20) = 0.1095
1.96 SE' = 0.2147
Lower = 0.4 – 0.2147 = 0.1853 = 18.53%
Upper = 0.4 + 0.2147 = 0.6147 = 61.47%
nPQ = 4.8 น้อยกว่า 5 จึงไม่แนะนำให้ใช้ Wald Method แนะนำให้ใช้ Wilson Score
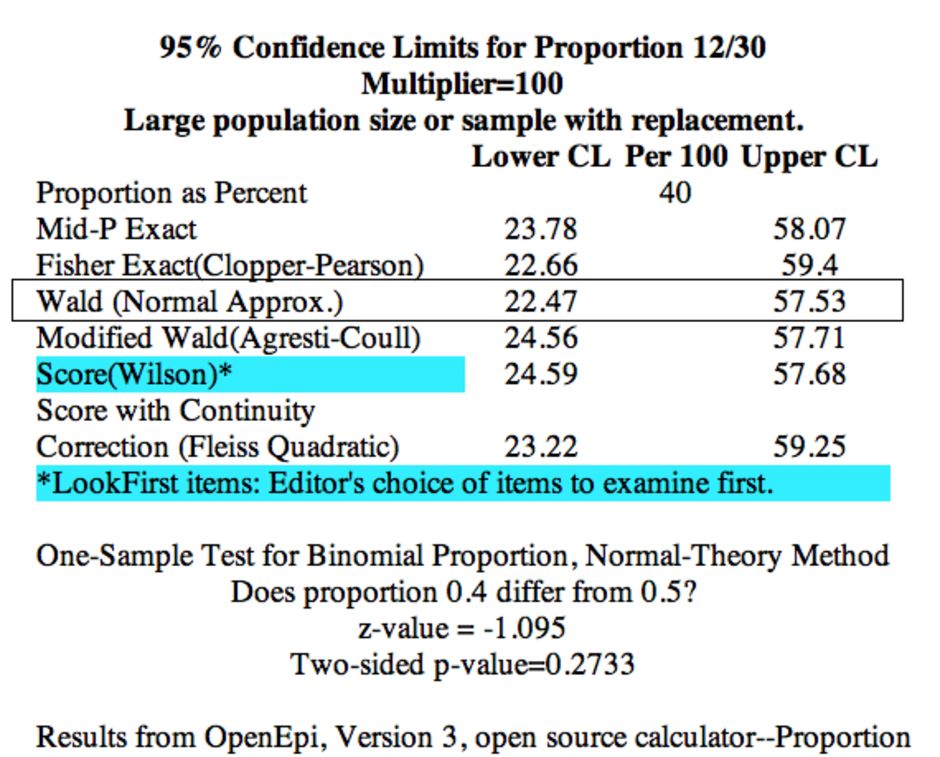
ภาพที่ 2 p=0.4 q=0.6 n=30
nP = 12 … (> 5) = Mean
nQ = 18 … (> 5)
nPQ = 7.2 … (>5)
SE' = sqrt(.4*.6/30) = 0.089442
1.96*SE' = 0.1753
Lower = 0.4 - 0.1753 = 0.2247 = 22.47%
Upper = 0.4 + 0.1753 = 0.5753 = 57.53%
โปรแกรม STATA หาค่า 95% CI ของ Proportion
โดยใช้คำสั่ง cii #obs #succ [, ciib_options]
[, ciib_options] เช่น exact, poisson, wald, agresti, wilson, และ jeffreys
ตัวอย่าง n = 20, P = 0.4 (เป็น Proportion โดยค่าส่วน = 1)
options ไม่ระบุ จะเป็นค่า ฺBinomial Exact และ options ระบุ Wald และ Wilson
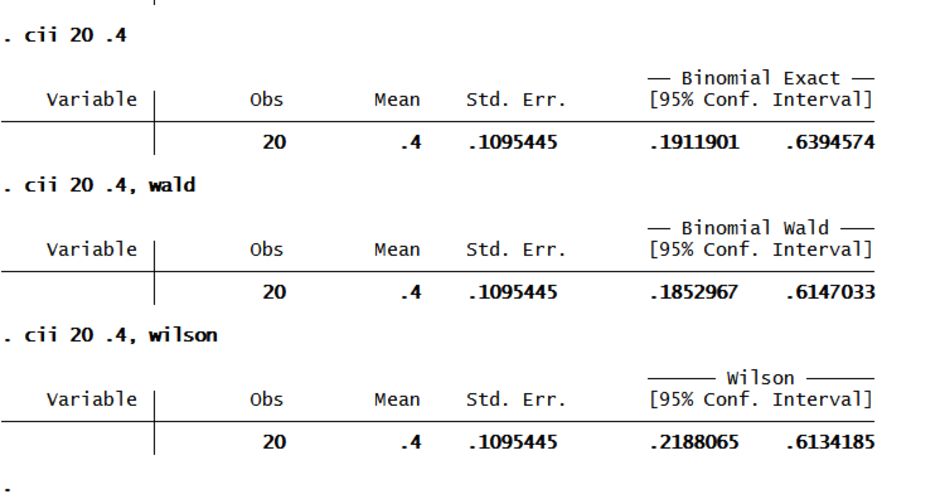
ภาพที่ 3
Obs = 20, Mean = 0.4, Proportion = 40%
Std. Err. = sqrt(PQ) / sqrt(n) = 0.1095445
ปรับค่า 95%CI ให้เป็น %
95%CI = 19.11 to 63.94 Binomial Exact
95%CI = 18.52 to 61.47 Binomial Wald
95%CI = 21.88 to 61.34 Wilson
Binomial Distribution เช่น โยนเหรียญ 1 อัน 8 ครั้ง นับจำนวนครั้งที่ออกหัว (success)
n=8, p=0.5 q=1-p, Mean = 4, Variance = 2
"Mean = np, "Variance = npq", Mean and Variance of the Binomial Distribution.
http://www.stat.yale.edu/Courses/1997-98/101/binom.htm
Z distribution
Standardized Normal Curve, Mean=0, SD=1
https://dl.dropboxusercontent.com/u/1999671/EPI_56/distribution/z.htm
http://epistat.usite.pro/distribution/z.htm