Logistic Regression คือการ Regress โดยใช้ Natural logarithm ของ Odds, ln(Odds) เป็น Model เส้นตรง, Odds Ratio และ 95%Conf. Interval
DropBox : Logistic Regression
https://dl.dropboxusercontent.com/u/1999671/EPI_56/logistic/logistic.htm
|
Logistic Regression คือการ Regress โดยใช้ Natural Logarithm ของ Odds Scatter Plot ของ P และ ln(Odds) เป็นเส้นตรง ln(Odds) = a + bX Odds Ratio และ 95% Conf. Interval ถ้า P คือ Probability ของ Outcome เช่น การป่วย คำนวณค่า Odds ได้จาก P, Odds = [P/(1-P)] Scatter Plot P และตัวแปรต้น กราฟเป็นแบบ S-Shape (Logistic Curve) Scatter Plot P และ Odds กราฟเป็นแบบ Exponential Scatter Plot P และ ln(Odds) กราฟเป็นเส้นตรง ln[P/(1−P)] = a + bX a คือ Intercept, b คือ Slope ln(Odds) คือ log ฐาน e (e=2.71828) หรือ Natural Log ของ Odds ถ้าตัวแปรต้นเพิ่ม 1 หน่วย Odds Ratio = eb ถ้า Odds Ratio = 1.4 หมายถึง ถ้าตัวแปรต้น X เพิ่มขั้น 1 หน่วย ความเสี่ยงที่จะป่วย Y จะเพิ่มเป็น 1.4 เท่า (ของความเสี่ยงที่จะป่วยเดิม) |
Logistic Regression
ตัวแปรตาม "Y" ที่คาดว่าอาจจะเป็นผล เป็นตัวแปรชนิด มีได้ 2 แบบ (Dichotomous Variable)
เช่น Yes/ no, Success/ Failure, Male/ Female, True/ False
ตัวแปรต้น "X" ตัวแปรอิสระ หรือ Predictor เป็นแบบ Continuous Variable
ค่าต่อเนื่องมีเลขทศนิยมได้ได้มาจากการ ชั่ง ตวง วัด (Measured )
สำหรับ Logistic Regression จะใช้เป็นตัวแปรประเภทใดก็ได้
ถ้ามีตัวแปรต้น 1 ตัวแปร คือ Logistic Regression ชนิด "ตัวแบบถดถอยโลจิสติกอย่างง่าย"
Simple Logistic Regression บางตำราเรียกเป็น uni-variate analysis
ถ้าตัวแปรต้นมีหลายตัวแปร คือ Multiple Logistic Regression
"ถ้าตรวจอาการของผู้ที่มีระดับโคเลสเตอรอลต่างๆกัน
ติดตามอาการไป 10 ปี ว่าจะเริ่มป่วยโรคหัวใจหรือไม่
กลุ่มป่วยมีค่าเฉลี่ยระดับโคเลสเตอรอลเท่าไร
กลุ่มไม่ป่วยมีค่าเฉลี่ยระดับโคเลสเตอรอลเท่าไร
ถ้าข้อมูลเป็น Normal distribution ใช้ t-test compare mean"
Ho : โคเลสเตอรอลไม่มี Association กับโรคหัวใจ
Ha : โคเลสเตอรอลมี Association กับโรคหัวใจ
"Logistic Regression จะคาดคะเน (Predict) ว่า
ระดับโคเลสเตอรอลค่านี้อีก 10 ปี ความเสี่ยงที่จะป่วยเป็นเท่าไร
ระดับโคเลสเตอรอลเเป็นตัวแปรต้น เป็นตัวแปรค่าต่อเนื่อง (Continuous Variable)ได้จากการวัด
ถ้าระดับโคเลสเตอรอลลดลง 1 หน่วย ความเสี่ยงที่จะป่วยลดลงเป็นเท่าไร"
"ตัวแปรตามเป็นการฟักไข่มังกรโคโดโมเป็นตัวผู้หรือตัวเมีย
ตัวแปรต้นเป็นอุณหภูมิซึงเป็นตัวแปรค่าต่อเนื่อง
การทดลองตั้งค่าอุณหภูมิได้เป็นครั้งๆ เช่น
ตัวผู้ 6/10 ที่อุณหภูมิ 30 องศา (Success 60% N=10)
ตัวผู้ 15/30 ที่อุณหภูมิ 32 องศา (Success 50% N=30)
Ho : การฟักไข่ได้เป็นตัวผู้ ไม่มี Association กับอุณหภูมิ
Ha : การฟักไข่ได้เป็นตัวผู้ มี Association กับอุณหภูมิ
การใช้ linear regression อาจไม่เหมาะสม เพราะจำนวน N ของแต่ละกลุ่มไม่เท่ากัน
ใช้ Logistic Regression สำหรับการทดสอบสมมติฐานนี้
การทดสอบสมมติฐานที่เป็นตัวแปรแบบ 2x2 table ใช้ Chi Square ก็ทดสอบได้เช่นกัน"
การวัดค่าตัวแปรตาม Y มีโรคหัวใจ, ไม่มีโรคหัวใจ
ความเสี่ยงที่จะเกิดโรค (P) มีค่าระหว่าง 0 ถึง 1
ถ่าความเสี่ยงที่จะเกิดโรค P = 0.25
ความเสี่ยงที่จะไม่เกิดโรค (1 - P) = (1 - 0.25)
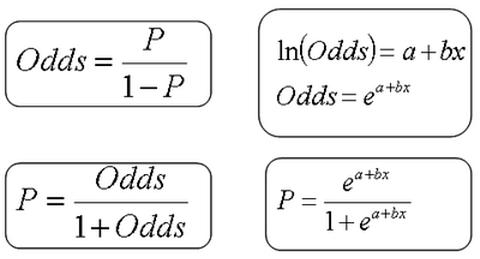
Odds = P / (1 - P)
Odds ของการเกิดโรคหัวใจ = 0.25 / 0.75 = 1 / 3
Odds = 3 หรือ Odds = 1 / 3 มีขนาดเท่ากันแต่ทิศทางกลับทิศกัน
103 เท่ากับ 1000 และ log(1000) =3
102 เท่ากับ 100 และ log(100) = 2
101 เท่ากับ 10 และ log(10) = 1
100 เท่ากับ 1 และ log(1) = 0
10-1 เท่ากับ 1/10 และ log(0.1) = -1
10-2 เท่ากับ 1/100 และ log(0.01) = -2
10-3 เท่ากับ 1/1000 และ log(0.001) = -3
Odds = 2 หรือ Odds = 0.5 มีขนาดเท่ากันแต่ทิศทางกลับทิศกัน
Odds = 10 หรือ Odds = 0.1 มีขนาดเท่ากันแต่ทิศทางกลับทิศกัน
Odds = 100 หรือ Odds = 0.01 มีขนาดเท่ากันแต่ทิศทางกลับทิศกัน
Scatter Plot ของ P และ Odds เป็นกราฟแบบ Exponential
ใช้ค่า Natural logarithm ของ Odds ใช้ค่า ln(Odds)
คือ log ฐาน e (e=2.71828) จะเหมาะสมกว่าใช้ Log ของเลขฐาน 10
และสมการของ Logistic Regression คือ ln[P/(1−P)] = a + bX
Examples
 |
| An amphipod crustacean, Megalorchestia californiana. |
Source: http://udel.edu/~mcdonald/statlogistic.html
http://www.biostathandbook.com/simplelogistic.html
"McDonald (1985) counted allele frequencies at the mannose-6-phosphate isomerase (Mpi) locus in the amphipod crustaceanMegalorchestia californiana, which lives on sandy beaches of the Pacific coast of North America. There were two common alleles, Mpi90 and Mpi100. The latitude of each collection location, the count of each of the alleles, and the proportion of the Mpi100 allele, are shown here:"
 location          latitude  Mpi90  Mpi100  p, Mpi100
Port Townsend, WA    48.1      47    139     0.748
Neskowin, OR         45.2     177    241     0.577
Siuslaw R., OR       44.0    1087   1183     0.521
Umpqua R., OR        43.7     187    175     0.483
Coos Bay, OR         43.5     397    671     0.628
San Francisco, CA    37.8      40     14     0.259
Carmel, CA           36.6      39     17     0.304
Santa Barbara, CA    34.3      30      0     0.000
"Allele (Mpi90 or Mpi100) is the nominal variable, location is the hidden nominal variable, and latitude is the measurement variable. If the biological question were "Do different locations have different allele frequencies?", you would ignore latitude and do a chi-square or G-test of independence; here the biological question is "Are allele frequencies associated with latitude?"
Note that although the proportion of the Mpi100 allele seems to increase with increasing latitude, the sample sizes for the northern and southern areas are pretty small. Doing a logistic regression, the result is chi2=83.3, 1 d.f., P=7×10⁻²⁰. The equation is
ln(Y/(1−Y))=−7.6469+0.1786(latitude),
where Y is the predicted probability of getting an Mpi100 allele. Solving this for Y gives
Y=e−7.6469+0.1786(lat)/(1+e−7.6469+0.1786(lat)).
This logistic regression line is shown on the graph; note that it has a gentle S-shape."
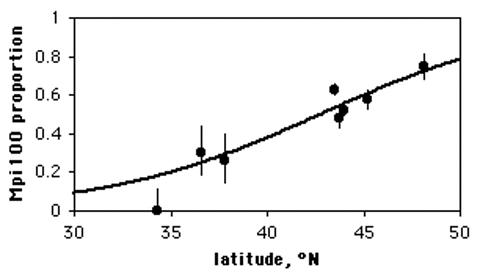
Source: http://www.biostathandbook.com/simplelogistic.html
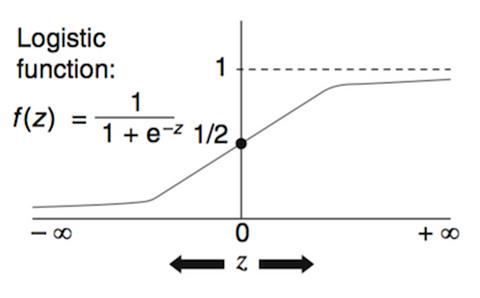
Source: David G. Kleinbaum, Mitchel Klein. Logistic Regression: A Self-Learning Text
| ถ้า Z มีค่ามากเข้าใกล้ infinity | f(z) = 1 / (1+0) | f(z) = 1 |
| ถ้า Z มีค่าน้อยเข้าใกล้ลบ infinity | f(z) = 1 / (1+ infinity) | f(z) = 0 |
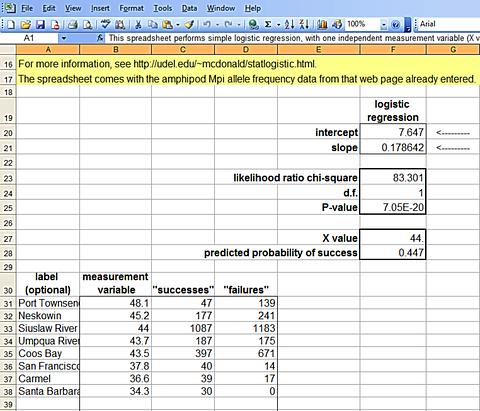
ไฟล์ Excel เพื่อคำนวณ Logistic Regression
intercept, slope, likelihood ratio chi-square
http://udel.edu/~mcdonald/statlogistic.xls
ไฟล์ statlogistic.xls ลงค่า latitude, Success, Failure มาด้วยแล้ว
ท่านผู้อ่านอาจ download จาก Google Doc และติดตั้ง Add in "Solver"
Y = a + bX
a คือ intercept = 7.647
b คือ slope = 0.1786
Odds Ratio = eb = e0.1786 =1.19
ตาราง Excel กำหนดค่า "Success" คือ Mpi90, และ "Failure" คือ Mpi100
สลับที่กับตัวอย่างตอนต้น คำนวณได้ intercept เป็นค่าบวก
ต่างกับในบทความตอนต้นที intercept เป็นค่าลบ
http://www.gotoknow.org/posts/540323
Logistic Regression โดยใช้ STATA
1) หาค่า Odds Ratio และ 95%CI
2) หาค่า Coef. และ Cons. ของสมการเส้นตรง ln[P/(1−P)] = a + bX
3) Wald Statistic Ho: b = 0, if p < 0.05 reject Ho
4) -2LL ถ้ามีค่าน้อย หมายถึงใช้ตัวแปรต้น Predict ค่าตัวแปรตามได้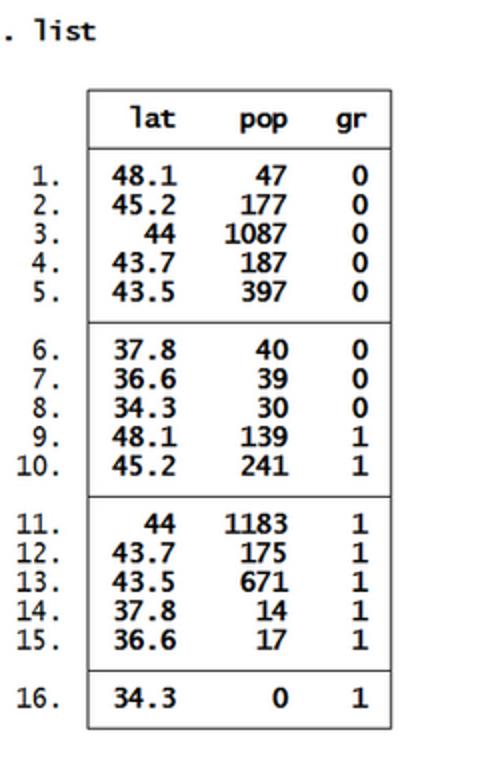

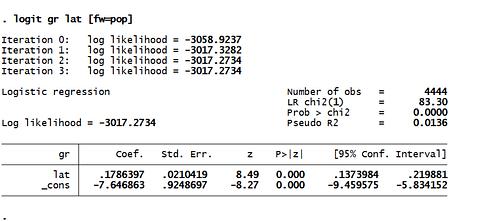
Coef. = 0.1786
Cons. = -7.6468
ln(odds) = a + bX
ln(odds) = -7.6468 + 0.1786 (latitude)

(1) [Prob > chi2] < 0.05 ใช้ Logistic model ได้
(2) Wald Statistic Ho: b = 0, [P>|z|] < 0.05 then reject Ho
(3) Odds Ratio = 1.19 95%CI 1.14 to 1.24 (* ไม่มี 1 รวมอยู่ด้วย)
Logistic Regression คือการ Regress natural logarithm ของ Odds
ln(Odds) เป็น Model เส้นตรง, Odds Ratio และ 95% Conf. Interval
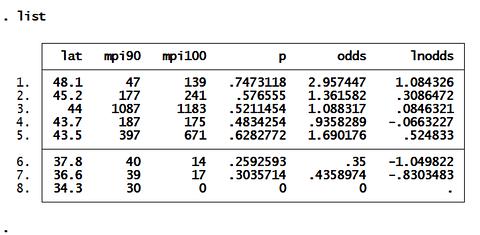
ตัวแปร Lat, mpi90, mpi100, P, odds, lnodds
P = mpi100 / (mpi90+mpi100)
Odds = P / (1 - P)
lnodds = ln(Odds)
1) Scatter Plot ค่า P และ Lat ได้กราฟ S-Shape
2) Scatter Plot ค่า Odds และ Lat ได้กราฟ Exponential
3) Scatter Plot ค่า P และ ln(Odds) ได้กราฟเส้นตรง
ln(Odds) = -7.6468 + 0.1786 (Latitude)
Odds Ratio =1.19 95%CI 1.14 to 1.24
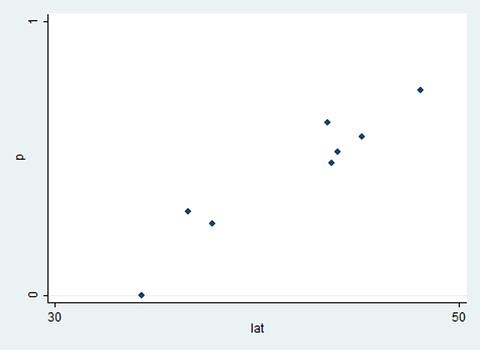
ภาพที่ 1 แกนตั้งเป็นค่า p (0 ถึง 1) แกนนอนเป็นค่า lat (30 ถึง 50) กราฟรูปร่าง S-shape
.scatter p lat, ylabel(0 1) xlabel(30 50)
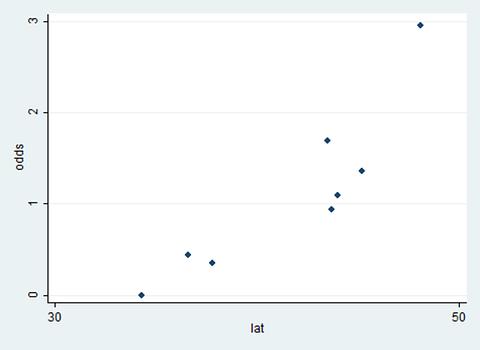
ภาพที่ 2 แกนตั้งเป็นค่า Odds แกนนอนเป็นค่า lat (30 ถึง 50) กราฟเป็นแบบ Exponential
.scatter odds lat , xlabel(30 50)
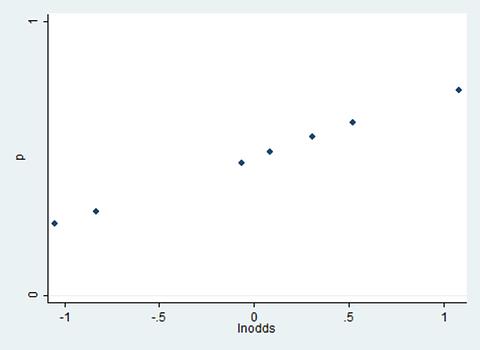
ภาพที่ 3 แกนตั้งเป็นค่า p (ค่า 0 ถึง 1) แกนนอนเป็นค่า ln(odds) กราฟเป็นเส้นตรง ln[P/(1−P)] = a + bX
.scatter p lnodds, ylabel(0 1)
log ฐาน 10
log(100) = 2
10 ยกกำลัง 2 = 100
log ฐาน e
ln(Odds) = a + bX
e (a + bX) = Odds
Odds = e (a + bX)
Odds Ratio = eb ถ้าตัวแปรต้นเพิ่มขึ้น 1 หน่วย
==========================
Odds_1 = ea+bX = ea.ebX
Odds_2 = ea+b(X+1) = ea.ebX.eb
Odds Ratio = ea.ebX.eb / ea.ebX
Odds Ratio = eb
==========================
|
Logistic Regression คือการ Regress โดยใช้ Natural logarithm ของ Odds คือ ln(Odds) เป็น Model เส้นตรง, Odds Ratio และ 95% Conf. Interval Scatter plot P และ Odds เป็น Exponential Curve Scatter plot P และ ln(Odds) เป็นสมการเส้นตรง ln[P/(1−P)] = a + bX ถ้าตัวแปรต้นเพิ่มขึ้น 1 หน่วย Odds Ratio = eb Odds Ratio = 1.2 หมายถึง ถ้าตัวแปรต้น X เพิ่มขึ้น 1 หน่วย ความเสี่ยงที่จะป่วย Y เพิ่มเป็น 1.2 เท่า (ของความเสี่ยงที่จะป่วยเดิม) |
References
http://udel.edu/~mcdonald/statlogistic.html
pp. 247-255 in: McDonald, J.H. 2009. Handbook of Biological Statistics (2nd ed.). Sparky House Publishing, Baltimore, Maryland.
อรุณ จิรวัฒน์กุล. ตัวแบบถดถอยโลจิสติกอย่างง่าย. วารสารวิจัยระบบสาธารณสุข.
ปีที่ 2 ฉบับที่ 1, มค.-มีค. 2551
http://www.hsri.or.th/upload/journal/v2n1/Arun-146
จิรุตม์ ศรีรัตน์บัลล์. การเลือกแบบจำลองทางสถิติ
สำหรับงานวิจัยระบบบริการสาธารณสุข. บทที่ 11
ทัสสนี นุชประยูร, เติมศรี ชำนิจารกิจ. สถิติในวิจัยทางการแพทย์ สำนักพิมพ์แห่งจุฬาลงกรณ์มหาวิทยาลัย
ฉัตรศิริ ปิยะพิมลสิทธิ์. Logistic Regression.
http://www.watpon.com/Elearning/logistic_regression.pdf
ฉลอง สีแก้วสิ่ว. Logistic Regression. Binary Logistic Regression Analysis.
http://applied-statistics.webs.com/logis_reg1.htm
http://applied-statistics.webs.com/logis_reg2.htm
David G. Kleinbaum, Mitchel Klein. Logistic Regression: A Self-Learning Text
ความเห็น (0)
ไม่มีความเห็น