
Webpage html และ Excel ใช้วิเคราะห์ Logistic Regression เปรียบเทียบกับโปรแกรม STATA
DropBox : Logistic Regression
https://dl.dropboxusercontent.com/u/1999671/EPI_56/logistic/logistic.htm
Webpage html วิเคราะห์ Logistic Regression
Logistic Regression คือการ Regress natural logarithm (Log ฐาน e) ของ Odds
ได้ค่า ln(Odds), Odds Ratio และ 95%Conf. Interval
Scatter Plot ของ P และ Odds กราฟเป็น Exponential
Scatter Plot ของ P และ ln(Odds) เป็นกราฟเป็นเส้นตรง
ln(Odds) = a + bX (a คือ intercept, b คือ slope และ Odds Ratio = eb
การสำรวจที่หาดทรายริมฝั่งมหาสมุทรปาซิฟิคของอเมริกาเหนือ
Allelles frequency ของ Amphipod ที่พบบ่อย คือ Mpi90 และ Mpi100
ถ้า Success คือ Mpi100 Odds Ratio 1.2
หมายถึง คาดว่าจะพบ Mpi100 เพิ่มเป็น 1.2 เท่าจากเดิม ถ้า latitude เพิ่มขี้น 1 องศา
WebPage ที่ใช้คำนวนค่า Logistic Regression
http://statpages.org/logistic.html

ค่าตัวเลขคั่นด้วย comma (หรือ tab) ใน Data Window
1. จำนวนบรรทัด = 10
2. จำนวนตัวแปรต้น = 1 Column แรกซ้าย เป็น Continuous Variable
(มี 1 Column ถ้าตัวแปรต้นมีตัวเดียว มี หลาย Column ถ้าตัวแปรต้นมีหลายตัว)
3. ไม่ click check box เพราะเป็นตัวแปรตามชนิด Dichotomous 0 หรือ 1
4. ตัวเลขคั่นด้วย comma (หรือ tab)
5. Click [ Solve ]
Example
http://udel.edu/~mcdonald/statlogistic.html
WebPage ที่ใช้คำนวณค่า Logistic Regression
http://statpages.org/logistic.html
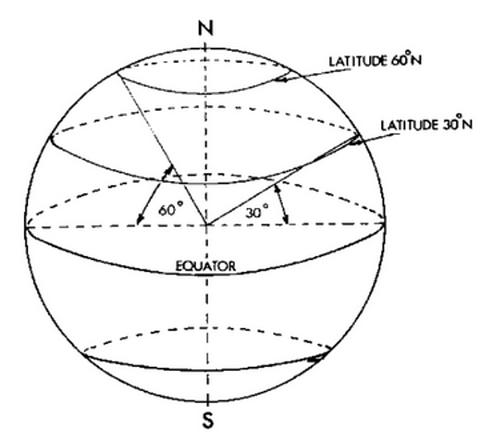
Latitude
เป็น Measurement Variable ตัวแปรค่าต่อเนื่องมีทศนิยมได้
เป็น "ตัวแปรต้น" เช่น ที่ ซานฟรานซิสโก, คาลิฟอร์เนีย latitude 37.8 องศาเหนือ

| An amphipod crustacean, Megalorchestia californiana. |
Allele frequency in the Amphipod คือ Mpi90 และ Mpi100
เป็น "ตัวแปรตาม" ที่มี 2 ค่า คือ พบ Mpi100 และ Not Mpi100 (คือ Mpi90)
P = Mpi100 / (Mpi90 + Mpi100)
Source: http://udel.edu/~mcdonald/statlogistic.html
 location          latitude  Mpi90  Mpi100  p, Mpi100
Port Townsend, WA    48.1      47    139     0.748
Neskowin, OR         45.2     177    241     0.577
Siuslaw R., OR       44.0    1087   1183     0.521
Umpqua R., OR        43.7     187    175     0.483
Coos Bay, OR         43.5     397    671     0.628
San Francisco, CA    37.8      40     14     0.259
Carmel, CA           36.6      39     17     0.304
Santa Barbara, CA    34.3      30      0     0.000
การสำรวจ Amphipod ที่หาดทรายบริเวณชายฝั่งของมหาสมุทรปาซิฟิคที่อเมริกาเหนือ
"There were two common alleles, Mpi90 and Mpi100.
The latitude of each collection location, the count of each of the alleles,"
ตัวแปรต้น คือ latitude คือเส้นแลตติจูด ของชายหาด เป็น continuous variable
ตัวแปรตาม เป็นจำนวน summary data ของ Mpi100 และ not Mpi100 (หมายถึง Mpi90)
P ของการพบ alleles ชนิด Mpi100 = Mpi100 / (Mpi100 + Mpi90)
การลงข้อมูลใน WebPage
1. จำนวนบรรทัด = 8
2. จำนวนตัวแปรต้น = 1 (คือจำนวน 1 Column ซ้ายมือ, มีหลาย Column ถ้าตัวแปรต้นมีหลายตัว)
3. Click check box [x] ข้อมูลเป็นจำนวน Summary ของ ตัวแปรตาม เช่น 47, 139
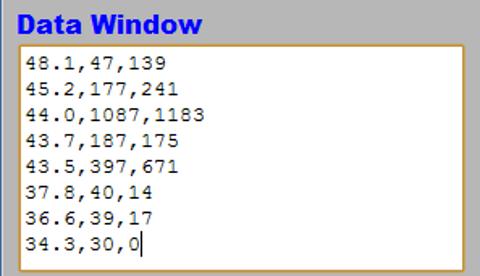
4. Copy data 8 บรรทัด ตัวเลขคั่นด้วย comma (หรือ tab) ไปวางที่ Data Windows
48.1, 47, 139
45.2, 177, 241
44.0, 1087, 1183
43.7, 187, 175
43.5, 397, 671
37.8, 40, 14
36.6, 39, 17
34.3, 30, 0
5 Click the [ Solve ] คำนวณค่าใน Results Window
http://statpages.org/logistic.html

Descriptives...
2004 cases have Y=0; 2440 cases have Y=1.
Variable Avg SD
1 43.9058 1.6401
Iteration History...
-2 Log Likelihood = 6117.8474 (Null Model)
-2 Log Likelihood = 6034.9730
-2 Log Likelihood = 6034.5469
-2 Log Likelihood = 6034.5467
-2 Log Likelihood = 6034.5467 (Converged)
Overall Model Fit...
Chi Square= 83.3007; df=1; p= 0.0000
Coefficients and Standard Errors...
Variable Coeff. StdErr p
1 0.1786 0.0210 0.0000
Intercept -7.6469
Odds Ratios and 95% Confidence Intervals...
Variable O.R. Low -- High
1 1.1956 1.1473 1.2459
ln(P/1-P) = -7.6469 + 0.1786(latitude)
Odds Ratio = eb = e0.1786 = 1.19
Source: http://udel.edu/~mcdonald/statlogistic.html
"McDonald (1985) counted allele frequencies at the mannose-6-phosphate isomerase (Mpi) locus in the amphipod crustacean Megalorchestia californiana, which lives on sandy beaches of the Pacific coast of North America. There were two common alleles, Mpi90 and Mpi100. The latitude of each collection location, the count of each of the alleles, and the proportion of the Mpi100 allele, are shown here:"
 location          latitude  Mpi90  Mpi100  p, Mpi100
Port Townsend, WA    48.1      47    139     0.748
Neskowin, OR         45.2     177    241     0.577
Siuslaw R., OR       44.0    1087   1183     0.521
Umpqua R., OR        43.7     187    175     0.483
Coos Bay, OR         43.5     397    671     0.628
San Francisco, CA    37.8      40     14     0.259
Carmel, CA           36.6      39     17     0.304
Santa Barbara, CA    34.3      30      0     0.000
"Alllele คือ Mpi90 หรือ Mpi100 เป็นตัวแปรชนิด Nominal Scale
Location เช่น ชายหาด Port Towsend, WA เป็นตัวแปรชนิด Nominal Scale
latitude เป็นตัวแปรค่าต่อเนื่องได้จากการวัด
สถานที่ต่างกันพบ Alllele Freguency ต่างกันหรือไม่? ทดสอบสมมติฐานด้วย chi-square
Alllele Freguency มี association กับแลตติจูดหรือไม่"
Logistic Regression ถ้า Odds Ratio = 1.2 การสำรวจ Mpi100 และ Mpi90
จะพบ Mpi100 เป็น 1.2 เท่า ของการพบ Mpi100 เดิม ถ้าแลตติจูดเพิ่มขึ้น 1 หน่วย
"Allele (Mpi90 or Mpi100) is the nominal variable, location is the hidden nominal variable, and latitude is the measurement variable. If the biological question were "Do different locations have different allele frequencies?", you would ignore latitude and do a chi-square or G-test of independence; here the biological question is "Are allele frequencies associated with latitude?"
Note that although the proportion of the Mpi100 allele seems to increase with increasing latitude, the sample sizes for the northern and southern areas are pretty small. Doing a logistic regression, the result is chi2=83.3, 1 d.f., P=7×10⁻²⁰. The equation is
ln(Y/(1−Y))=−7.6469+0.1786(latitude),
where Y is the predicted probability of getting an Mpi100 allele. Solving this for Y gives
Y=e−7.6469+0.1786(lat)/(1+e−7.6469+0.1786(lat)).
This logistic regression line is shown on the graph; note that it has a gentle S-shape."

Source : http://udel.edu/~mcdonald/statlogistic.html
Logistic Regression โดยใช้ Excel
Source: http://udel.edu/~mcdonald/statlogistic.html
intercept, slope, likelihood ratio chi-square
http://udel.edu/~mcdonald/statlogistic.xls
ท่านผู้อ่านอาจ Download statlogistic.xls จาก Google doc
และติดตั้ง Add ins "Solver"
"Success" คือ Mpi90 และ "Failure" คือ Mpi100
Success และ Failure วางสลับที่กันกับตัวอย่างแรก
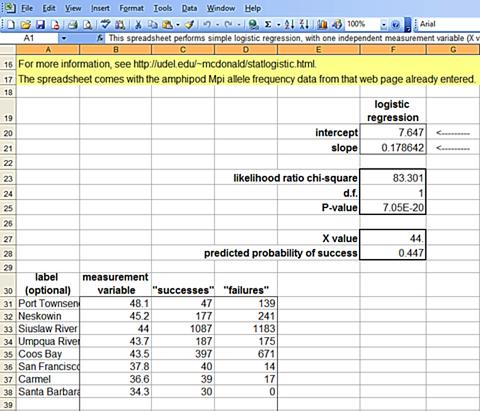
อาจไม่ต้องใส่ชื่อเมือง เช่น Port Townsend, Neskowin, ...San Francisco
measurement variable คือตัวแปรต้น latitude เป็น continuous variable
ตัวแปรตาม เป็น Dichotomous Variable
"Success" คือ Mpi90, "Failure" คือ not Mpi90 (คือ Mpi100)
และ Success และ Failure สลับที่กันกับตัวอย่างแรก
a = Intercept = -7.647
b = Slope = 0.178642
Likelihood Ratio Chi-Square = 83.301
คำนวณค่า Odds Ratio จากค่า "b"
Odds Ratio = eb = 1.19
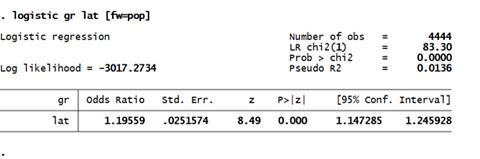
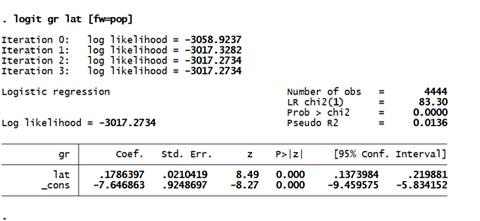
Logistic Regression โดยใช้ STATA
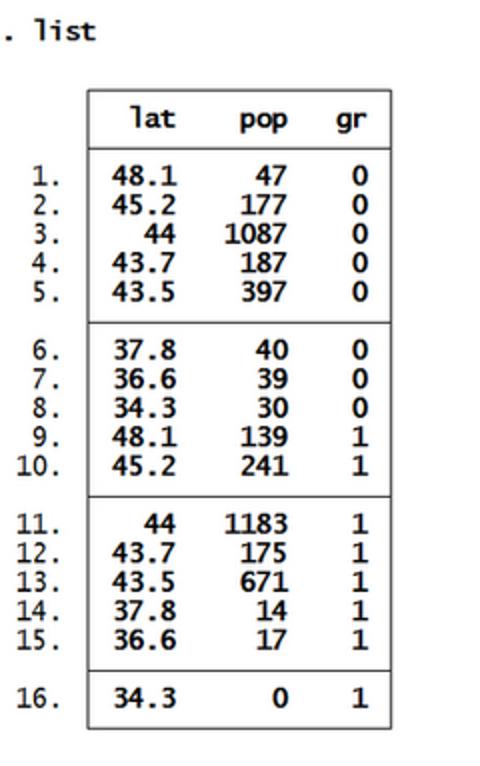
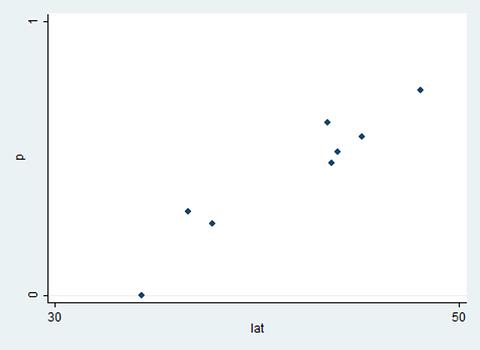
Scatter Plot P และ Latitude กราฟเป็น S-Shape
.png)
(1) [Prob > chi2] < 0.05 ใช้ Logistic model ได้
(2) Wald Statistic Ho: b = 0, [P>|z|] < 0.05 then reject Ho
(3) Odds Ratio = 1.19 95%CI 1.14 to 1.24 (* ไม่มี 1 รวมอยู่ด้วย)
Logistic Regression โดยใช้โปรแกรม Excel (with Solver) และ STATA
Logistic Regression คือการ Regress natural logarithm ของ Odds
ได้ค่า ln(Odds), Odds Ratio, 95%Conf. Interval
Scatter Plot ของ P และ Odds กราฟเป็น Exponential
Scatter Plot ของ P และ ln(Odds) กราฟเป็นเส้นตรง
http://www.gotoknow.org/posts/540121
ความเห็น (0)
ไม่มีความเห็น