
Mantel-Haenszel adjusted Odds Ratio ตัวเลขเดียวกันกับ เรื่อง Confounder
Cross-sectional Study ใช้ Chi Square หรือ Case Control ใช้ Odds Ratio, Mantel-Haenszel
ตัวเลขเดียวกันกับเรื่อง Confounder
http://gotoknow.org/blog/epistat/437227
http://gotoknow.org/blog/epistat/437227
แต่สมมติให้เป็น Cross-sectional Study ที่ใช้ Chi Square,
หรือ Case Control Study ที่ใช้ Odds Ratio
และ Mantel-Haenszel Adjusted Odds Ratio
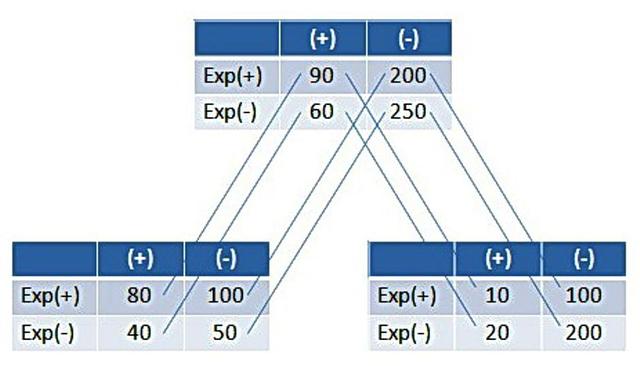
ถ้ารวมกัน Crude Odds Ratio คือ 1.87 คือต่างกัน 1.87 เท่า
ถ้าแยก 2 กลุ่ม Odds Ratio แต่ละกลุ่มจะไม่ต่างกัน คือ OR= 1
Crude OR ที่เคยได้ 1.87 ก็เป็น M-H Adjusted OR = 1
ถ้าแยก 2 กลุ่ม Odds Ratio แต่ละกลุ่มจะไม่ต่างกัน คือ OR= 1
Crude OR ที่เคยได้ 1.87 ก็เป็น M-H Adjusted OR = 1
|
Crude
(+) (-)
Exp(+) 90 200
Exp(-) 60 250
|
Crude OR= (90 / 60) / (200 / 250) = 1.87
|
|
| _1
(+) (-)
Exp(+) 80 100
Exp(-) 40 50
|
OR_1 = (80 / 40) / (100 / 50) = 1 |
|
|
OR_2 = (10 / 20) / (100 / 200) = 1
|
OpenEpi จัดเรียงชื่อหัวข้อ
ให้ Exp(+), Exp(-)ไว้ด้านซ้าย
Dis(+), Dis(-) ไว้ด้านบน
Crude OR=1.87 95% CI (2.28, 2.73)
Mantel-Haenszel adjusted OR=1
Stratum1 = OR=1
Stratum2 = OR=1
| dds-Based Estimates and Confidence Limits | |||||||
|---|---|---|---|---|---|---|---|
|
|
|||||||
| Point Estimates | Confidence Limits | ||||||
|
|
|||||||
| Stratum | Type | Value | Lower, Upper | Type | |||
|
|
|||||||
| 1 | CMLE Odds Ratio* | 1 | 0.6002, 1.67¹ | Mid-P Exact | |||
| 0.5828, 1.721¹ | Fisher Exact | ||||||
| Odds Ratio | 1 | 0.601, 1.664¹ | Taylor series | ||||
|
|
|||||||
| 2 | CMLE Odds Ratio* | 1 | 0.4337, 2.2¹ | Mid-P Exact | |||
| 0.402, 2.34¹ | Fisher Exact | ||||||
| Odds Ratio | 1 | 0.4511, 2.217¹ | Taylor series | ||||
|
|
|||||||
| Crude | CMLE Odds Ratio* | 1.873 | 1.287, 2.737¹ | Mid-P Exact | |||
| 1.267, 2.784¹ | Fisher Exact | ||||||
| Odds Ratio | 1.875 | 1.288, 2.73¹ | Taylor series | ||||
| Etiologic fraction in pop.(EFp|OR) | 28% | 12.69, 43.31 | |||||
| Etiologic fraction in exposed(EFe|OR) | 46.67% | 22.33, 63.38 | |||||
|
|
|||||||
| Adjusted | CMLE Odds Ratio* | 1 | 0.6494, 1.536¹ | Mid-P Exact | |||
| 0.6355, 1.569¹ | Fisher Exact | ||||||
| Directly Adjusted OR | 1 | 0.6512, 1.536¹ | Taylor series | ||||
| Mantel-Haenszel OR | 1 | 0.6512, 1.536¹ | Robins,Greenland,Breslow | ||||
| Breslow-Day test for interaction of Odds Ratio over strata: | |||||||
| chi square= | 0.0 | p= | 1 | ||||
| p greater than 0.05 does not suggest interaction. Adjusted OR can be used. | |||||||
|
|
|||||||
| *Conditional maximum likelihood estimate of Odds Ratio | |||||||
| (P)indicates a one-tail P-value for Protective or negative association; otherwise one-tailed exact P-values are for a positive association. Martin,D; Austin,H (1991) An efficient program for computing conditional maximum likelihood estimates and exact confidence limits for a common odds ratio. Epidemiology 2, 359-362. |
|||||||
| ° ¹ 95% confidence limits testing exclusion of 0 or 1, as indicated | |||||||
| P-values < 0.05 and confidence limits excluding null values (0,1, or [n]) are highlighted. | |||||||
| LookFirst items: Editor's choice of items to examine first. | |||||||
Results from OpenEpi, Version 2, open source calculator--TwobyTwo
file:///Z:/today2011-05-04/2011-May-24/OpenEpi/TwobyTwo/TwobyTwo.htm
Source file last modified on 04/30/2011 17:16:31
Source file last modified on 04/30/2011 17:16:31
STATA
เรียงชื่อหัวข้อ ใน table 2x2 ต่างกับ OpenEPiSTATA จัดให้ Cases และ Controls ไว้ด้านซ้าย
Exposed, Unexposed ไว้ด้านบน
Exposed =1, Unexposed= 0
Cases =1, Controls= 0

Crude : Odds Ratio = 1.87 95% CI (1.26, 2.78 )
Weight by [fw=Var3]
Stratified, by (var4)
Stratified, by (var4)
M-H Odds Ratio = 1.0

Crude OR=1.87 95% CI (1.26, 2.78)
Mantel-Haenszel OR=1
Stratum_0 = OR=1
Stratum_1 = OR=1
Mantel-Haenszel OR=1
Stratum_0 = OR=1
Stratum_1 = OR=1
หมายเลขบันทึก: 438135เขียนเมื่อ 4 พฤษภาคม 2011 20:05 น. ()แก้ไขเมื่อ 19 มิถุนายน 2012 12:22 น. () สัญญาอนุญาต: ครีเอทีฟคอมมอนส์แบบ แสดงที่มา-อนุญาตแบบเดียวกันจำนวนที่อ่านจำนวนที่อ่าน:
ความเห็น (0)
ไม่มีความเห็น